Where rigorous research meets AI precision and turn evidence into decisions that create real societal and business impact.
Some of Our Ongoing Work
In this section, we present data collected from central and federal government repositories. Our team simplifies and organizes this information into an easy-to-understand, actionable, and visually engaging format. We design the data presentation to be both aesthetically appealing and practically useful, ensuring that decision-makers and the general public can easily interpret and apply the insights for informed decision-making.
Labour Force Participation in India: An Analysis of NSS Report No. 554 (2011-12)
Key Insights:
LFPR Definition: LFPR refers to the percentage of the working-age population (15 years and above) that is either employed or actively looking for work.
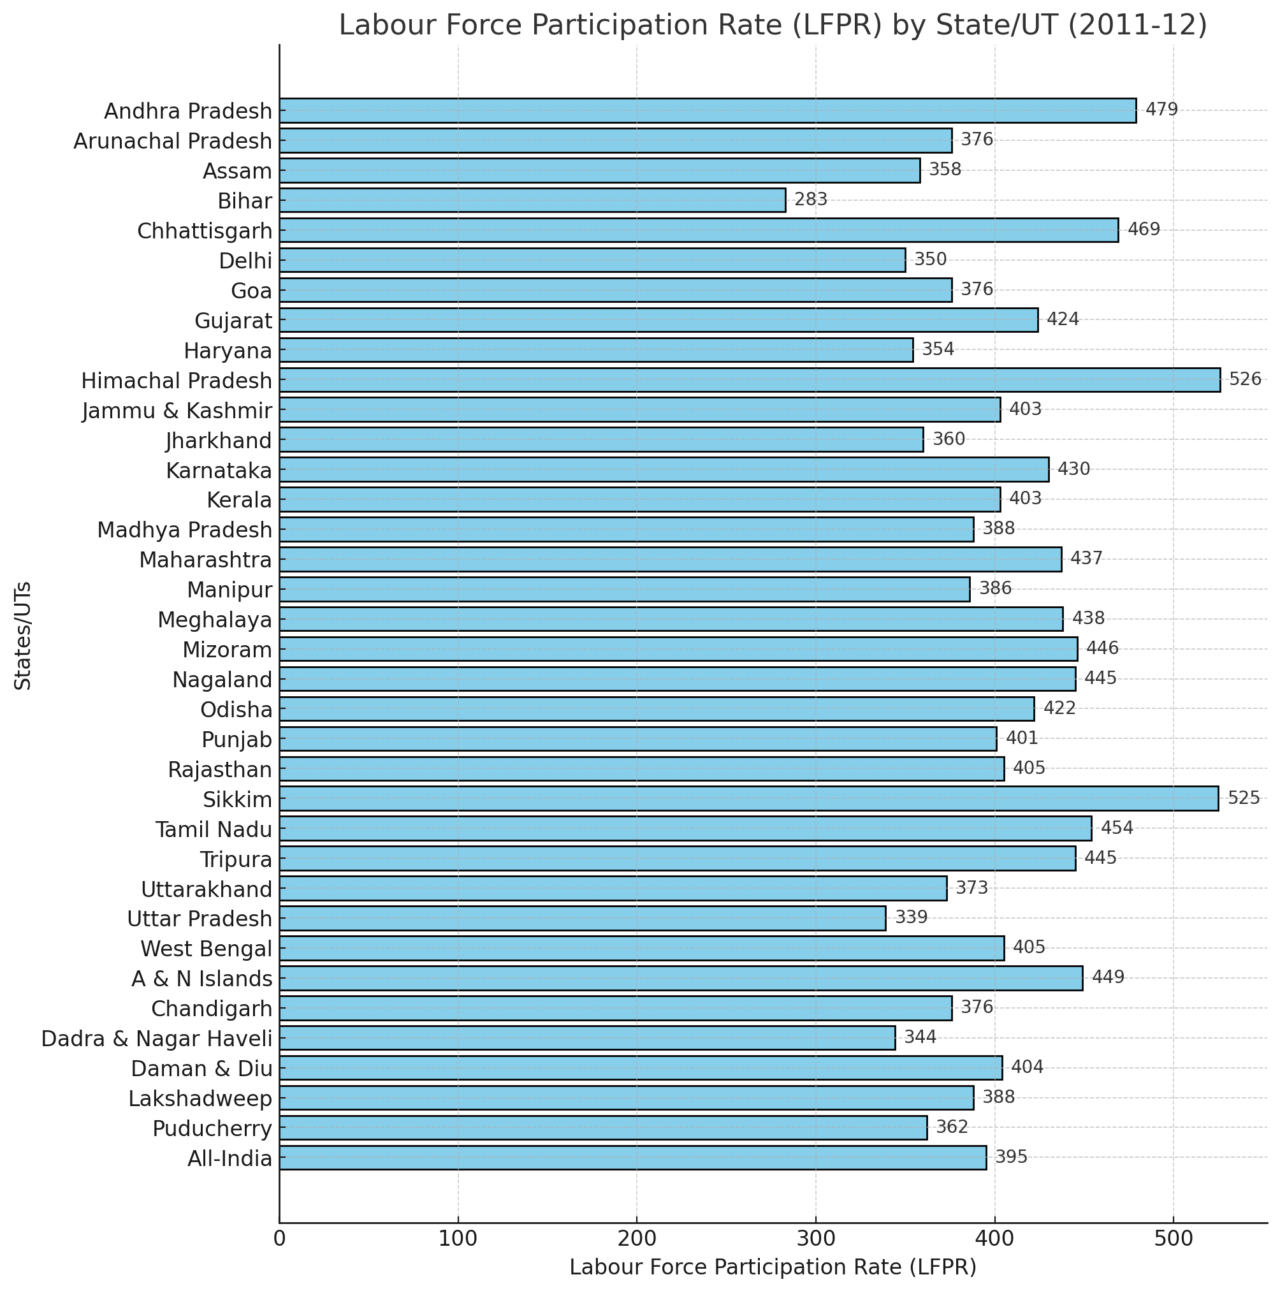
State Variations:
Highest LFPR: Himachal Pradesh (526) and Sikkim (525) have the highest labour force participation.
Lowest LFPR: Bihar (283) has the lowest participation rate, indicating a smaller proportion of the working-age population is engaged in economic activities.
All-India Average: The national average LFPR is 395, shown by the red dashed line.
Urban vs. Rural Disparity:
States with more rural populations, such as Himachal Pradesh and Chhattisgarh, have higher LFPR.
Urbanized states like Delhi (350) and Chandigarh (376) show lower LFPR, likely due to differences in job availability and workforce engagement.
This data provides a snapshot of India’s workforce engagement in 2011-12.
Analysis of Labour Force Participation Rate (LFPR) and Worker Population Ratio (WPR) Trends (2017-2023)
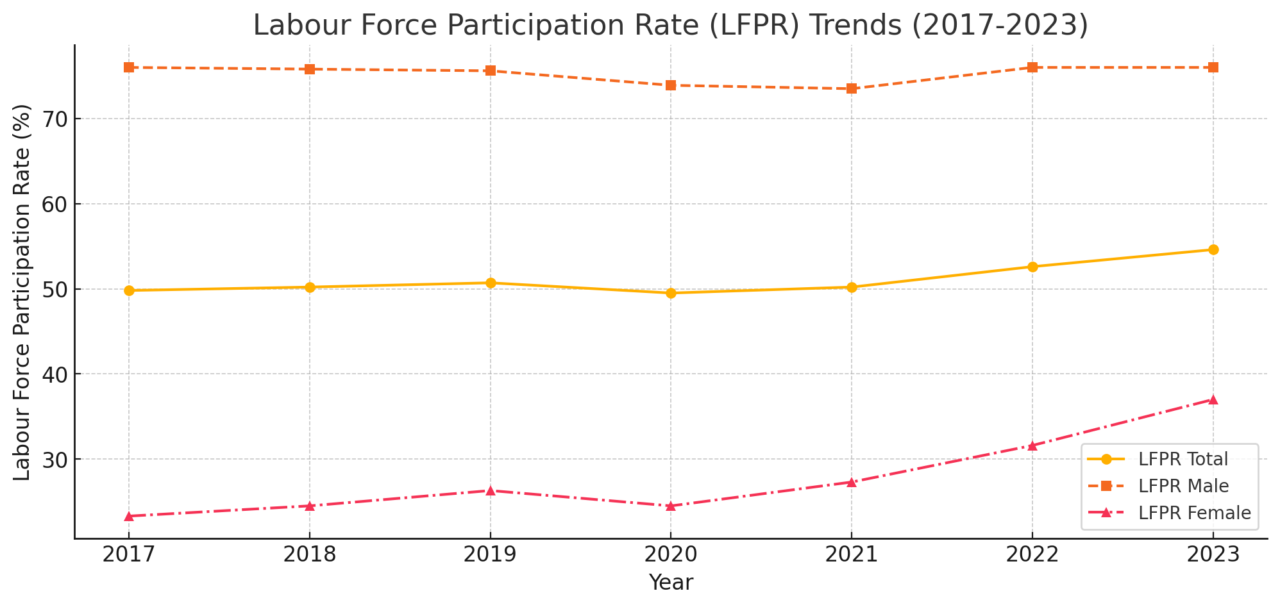
LFPR Trends:
The overall LFPR has shown a steady increase from 49.8% in 2017 to 54.6% in 2023.
Male LFPR has remained relatively stable, hovering around 73-76%.
Female LFPR has significantly increased from 23.3% in 2017 to 37% in 2023, indicating rising female participation in the workforce.
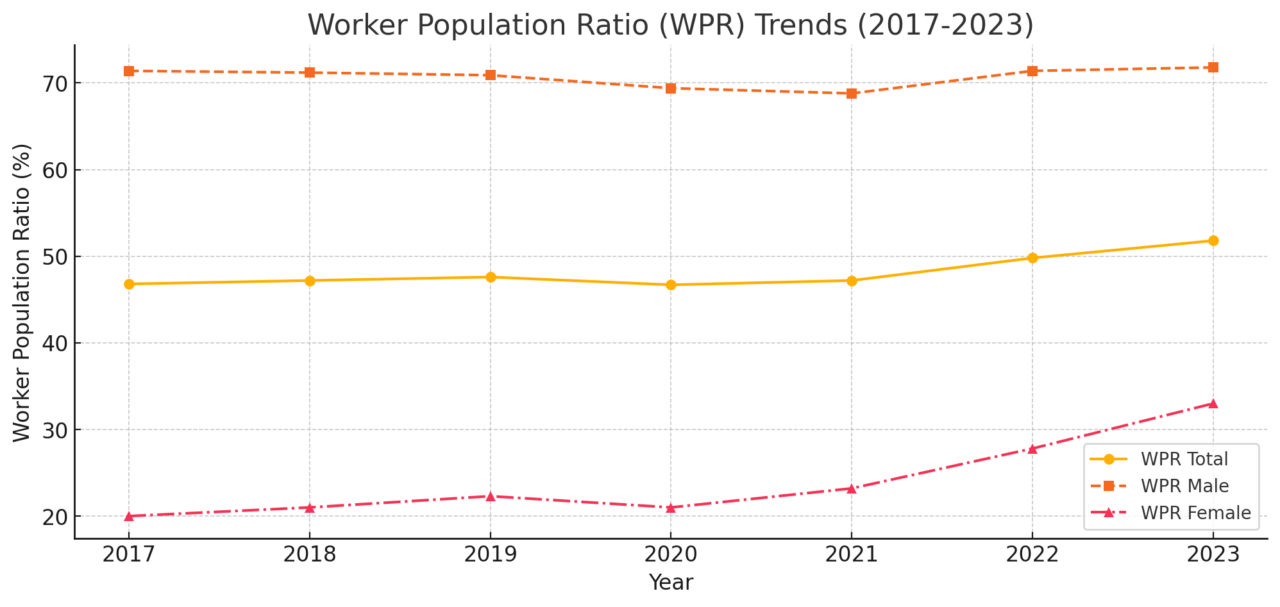
WPR Trends:
The overall WPR has improved from 46.8% in 2017 to 51.8% in 2023.
Male WPR has slightly declined from 71.4% to 71.8%, showing stability.
Female WPR has seen substantial growth from 20% in 2017 to 33% in 2023, highlighting better employment opportunities for women.
The data shows positive workforce trends, but gender gaps, regional imbalances, and skill mismatches remain key challenges. Targeted policy actions can enhance labor market participation and drive economic growth.
Key Insights
Findings
Policy Recommendations
Increase in Female Workforce Participation
Female LFPR rose from 23.3% (2017) to 37% (2023), and WPR from 20% to 33%.
Gender-friendly workplaces, childcare support, flexible work options.
Regional Disparities in LFPR
High LFPR in Himachal Pradesh (52.6%) & Sikkim (52.5%), but low in Bihar (28.3%) & UP (33.9%).
More job creation, industry investments, and skill training in low-LFPR states.
Urban vs. Rural Divide
Lower LFPR in urban areas like Delhi (35.0%) & Chandigarh (37.6%), higher in rural areas like Chhattisgarh (46.9%).
Expand employment programs in urban centers and promote self-employment in rural areas.
Skill Mismatch
Urban workforce participation is delayed due to higher education.
Align education with industry needs, strengthen vocational training.
Need for Regional Balance
Workforce participation varies across states, impacting economic growth.
Invest in labor-intensive sectors in low-LFPR states and tech-based jobs in urban centers.